By: Eunice Jean C. Patron
Scientists from the University of the Philippines – Diliman College of Science’s National Institute of Physics (UPD-CS NIP) have generated culture maps using data from the Integrated Values Survey (IVS).
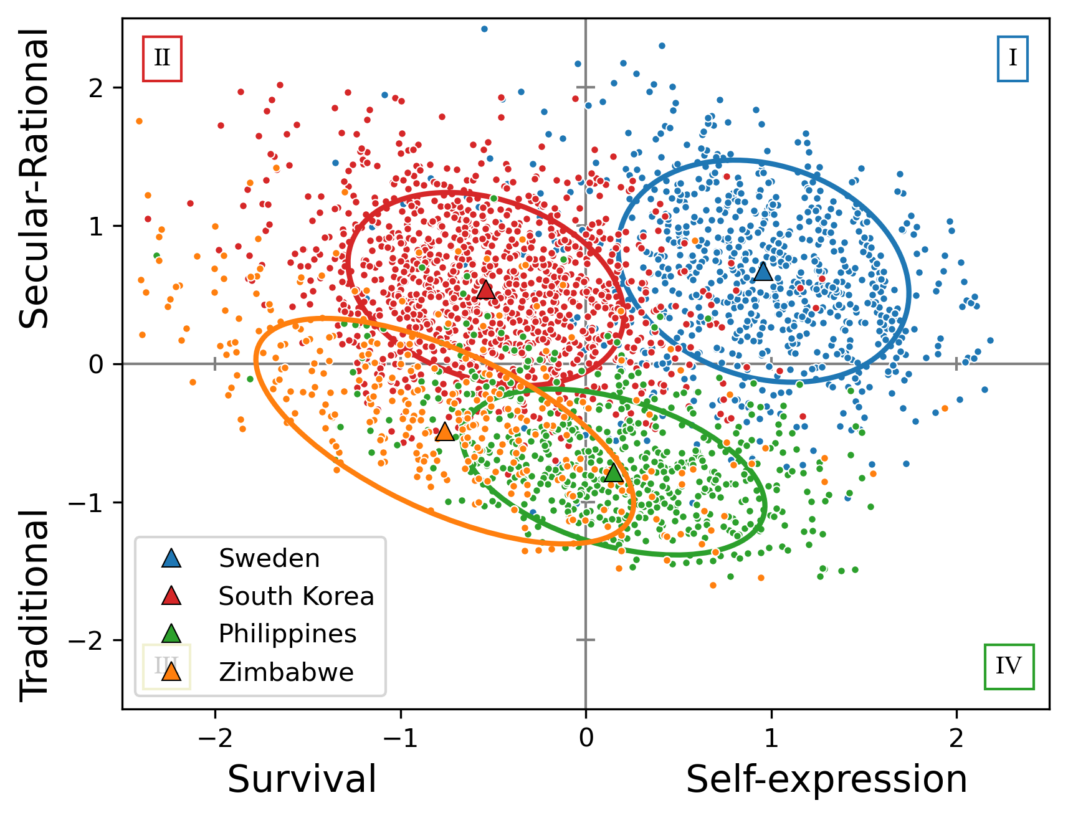
Using a method called principal component analysis (PCA), physicists John Lawrence Euste, Hannah Christina Arjonillo, and Dr. Caesar Saloma derived time-resolved pairs of complementary maps from the IVS data collected over forty years from over 120 countries: one showing cultural differences between countries, and the other showing cultural variations within a specific country, based on survey respondents. A total of seven separate surveys were conducted from 1981 to 2022.
Measuring culture change
“From our perspective as applied physicists, we wanted to detect and measure how culture has evolved, which is usually only described anecdotally,” Dr. Saloma shared, explaining that their work falls under sociophysics, a branch of physics concerned with modeling and quantifying social phenomena using methods initially developed in statistical and instrumentation physics. “We tried to quantify how culture varies over time in geographically separated populations,” he added.
Countries are represented as points on the first map. By tracking their movement over time, the team found that countries have generally become more focused on self-expression values. In the second map, the points represent respondents within each country. The team measured cultural diversity using the standard deviational ellipse (SDE) area. Countries with smaller SDEs exhibited less cultural diversity and tended to uphold more traditional values, while those with larger SDEs showed more cultural diversity and leaned more toward self-expression values.
“I looked into the literature to see if we could actually measure culture, and I found that there are models of cultural dynamics and change,” Euste said, explaining how he became interested in quantifying cultural change. “But then I realized that there weren’t many models that actually examined real-world cultural dynamics—how cultural values have changed based on actual empirical data.”
Transforming data into cultural maps
The physicists first aggregated the survey data (more than 300,000 total respondents) by averaging responses per country. Next, they applied PCA to the country-aggregated responses. This approach generated a map where each country is represented as a single point, making it easier to analyze cultural differences between countries.
“But the country-level map only shows each country as a single point, which doesn’t reflect the cultural diversity within countries. For example, the Philippines isn’t culturally homogeneous; it doesn’t make sense to represent the whole country with just one cultural profile,” Euste noted. So they used the transformation matrix derived from the country-level PCA. This matrix helps map individual responses into coordinates on the same cultural map, ensuring consistency between the country-level and respondent-level representations.
“This method ensures that the outputs from both levels are consistent,” Arjonillo added. “The third approach helps align the two, allowing us to compare both the country means and the full respondent distributions over time.”
At the country level, the physicists discovered that the Philippines is currently traditional—placing a high premium on religion, parent-child ties, deference to authority, and traditional family structures—but also leans toward self-expression through support for environmental protection, gender equality, and active participation in collective socio-economic life. From 1996 to 2019, the country has shown a slight decline in traditional values and a rise in self-expression.
Interestingly, the countries that are culturally closest to the Philippines are Latin American nations like Bolivia, Guatemala, Mexico, and Nicaragua—likely a reflection of the country’s history of over 300 years of Spanish colonization, rather than its geographic neighbors in East or Southeast Asia.
Real-world applications
The physicists believe that their findings and the approaches they used can serve as tools to support policymakers in decision-making. “The study can help people understand how cultural values change over time, guiding policymakers in tailoring policies that better align with a country’s cultural values,” Euste said. “This is useful for understanding broader cultural trends and how they evolve.”
Dr. Saloma explains that legislations, policies, and regulations are more effective if they are grounded on scientific evidence. “Policies work best when they rely on scientific data and findings; it’s why quantifying cultural evolution matters,” he added.
“[Our study] is still a work in progress,” Arjonillo concluded. “What’s important for us is to create tools for measurement—that’s the point of instrumentation. This is what we hope to evaluate and continue making progress on, not just in physics, but wherever we can find useful data.”
For interview requests and other concerns, please contact media@science.upd.edu.ph.
References:
Euste, J. L., Arjonillo, H. C., & Saloma, C. (2025). Time-resolved culture maps derived from the integrated values survey data (1981–2022). Physica A: Statistical Mechanics and its Applications, 659, 130317. https://doi.org/10.1016/j.physa.2024.130317


